So, if you have land on which to build storage space, or space that can be converted, this is the time to put it on the market. There are takers out there.

Showing posts with label job growth. Show all posts
Showing posts with label job growth. Show all posts
Wednesday, February 5, 2020
Got Warehouses?
The Town of Trumbull just announced a big warehouse deal by Amazon, who is opening a facility in North Haven also. Given our proximity to rail, water, NYC, and Boston, we are in demand as a region in an economy of delivery. Where will the supply come from? Since not much has been built, and since there is some oversupply in other types of flex space, what was built as office may now become warehouse space. While not providing the same number of jobs--which may be why Connecticut's 0.2% job growth is well below that of other states nationally and in New England-- such use does bring economic growth to our region. There's also a spillover effect into transportation and other ancillary sectors. Beggars can't be choosers. We have real estate, and distributors have needs.
Tuesday, October 11, 2016
The Irish Experience
We just got back from a quick trip on the new flight from Bradley to Ireland, and it was a terrific experience, but also instructional. Dublin is a city that, in some ways, would remind people of New Haven, but with more redheads. There are lots of students everywhere, a shortage of rental housing, a big university right in the center, new tech companies starting up, and more restaurants than you could ever believe would be needed (and mostly all full). Plus lots of beer--recently often craft beer. Also like New Haven, there has been little commercial building over the past ten years, while the economy lagged.
What's different about Dublin from New Haven? Well, it's a capital city, with all the economic power that that brings. It has a major airport, with easy, and cheap, access to many parts of the world. It's part of the EEU, and next to Britain, which just voted to leave that organization. It has great public bus transportation with the city and around the country, in addition to rail. It has lots and lots of tourists. And it attracts industry from other countries, including European headquarters of global firms.
Can we learn anything from their experiences? After all, they've had a rough ten years as well, and many types of property have declined in value. It's also much harder to get financing there, and lots of people can't get it. However, if we work on job growth, transportation infrastructure, and attracting new industry, maybe the people (even the redheads) will come.
Tuesday, June 7, 2016
Where Are All the Cranes?
I've been in Washington, D.C. and Boston recently, and both are hard to recognize from days past. There are cranes everywhere, and new neighborhoods are springing up, while the old ones are either gentrifying, or just increasing in price. It's amazing to see, in the case of Boston, what a difference 100 miles can make!
Both of those cities have been enjoying boom times, and Boston has been an outlier on the upper end of the growth curve in New England for some time. It has been successful in recruiting biotech companies with high-paying jobs, despite high housing prices, in part because it has reached critical mass in that field. Two-career families can both find employment, and there are lots of research universities around to feed the fire.
Could New Haven become a mini-Boston? In some ways, it already is. Cultural opportunities and the percentage of academics in the population surely rival Boston. Proximity to NYC is important, and we have that. What do we still need? More business and job growth--when Boston, in what's long been called Taxachusetts, seems better from a tax point of view, you know you're in trouble. Better transportation--investment in roads and railroads, plus expansion of Tweed's airline service. And, of course, a more positive reputation--are you listening in Hartford?
Thursday, December 10, 2015
Where the Fast-Growing Jobs Are
Written by Jed Kolko
The ups and downs of local job and housing markets are often tied to the fates of their key industries. Whether it’s tech in the Bay Area, oil in Houston, or manufacturing across much of the Midwest, the local job mix matters.
Yesterday the Bureau of Labor Statistics released its ten-year projections for occupational growth. This post shows which occupations are projected to grow or decline most; it also demonstrates the profound effect aging will have on labor demand and labor supply, and how the projections are good news for women and the well-educated. Healthcare-related occupations, along with personal care and computer & mathematical occupations, will grow fastest, while production (i.e. manufacturing) and farming/forestry/fishing occupations are projected to decline.
Which local markets are favored with fast-growing occupations or saddled with declining ones? I combined BLS national occupational projections for 2014-2024 with Census data on where occupations are located today, based on place of work (see note).

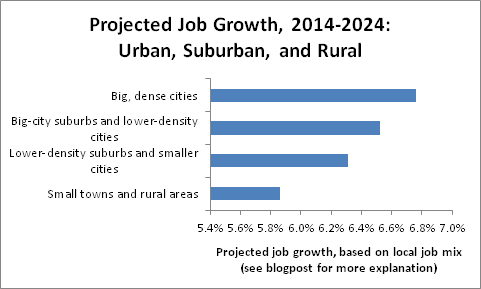
Occupations concentrated in urban areas are projected to grow faster than occupations in other areas. Based on where occupations are located today, urban jobs are projected to grow 6.8% over the next ten years, modestly ahead of suburbs, smaller cities, and rural areas. Rural jobs are disproportionately in manufacturing and natural-resource occupations, which are projected to decline. (This chart shows the weighted average of projected occupational growth in 2014-2014, weighted by today’s occupational mix in each type of area.)

The differences in overall projected occupational growth across areas aren’t huge, and that’s because only some occupations tend to be clustered in certain areas. Many large occupations, like secretaries, cashiers, elementary school teachers, and retail salespeople, are almost everywhere, so the occupational mix varies less across different locations that you might think.
Still, growth in occupations that don’t just serve the local population — like software developers or petroleum engineers — tends to boost growth in other occupations that do service the local population. For instance, if tech is booming and the oil industry is shrinking, then growth in other occupations catering to tech and oil workers — such as retail and personal services — could be faster in tech-heavy San Jose than in oil-dependent Houston. (Economists call this “local multipliers.”) Therefore, the projected differences across areas in occupational growth, shown above, probably understate the important of job mix to local growth.

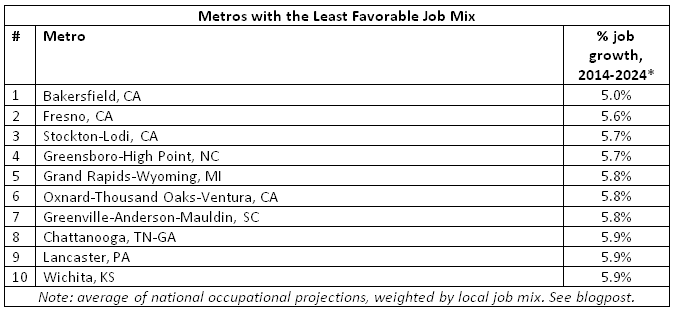
The inland California metros of Bakersfield, Fresno, and Stockton have the least favorable mix. These metros have young populations and therefore relatively few people in healthcare jobs; furthermore, they have substantial agricultural industries, and Bakersfield has a significant oil and gas industry as well. Largely absent from this list are Midwestern markets, despite their historical reliance on manufacturing.

The differences between metros are very small. Large metros aren’t as different in their occupational mix as you might think. Plus, remember that this approach might understate the impact of job mix on local growth because of the assumption that any given occupation will grow at the same rate in all places; that is, this approach ignores any multiplier effect.
But job mix isn’t necessarily local destiny. People move not only for jobs but also for personal reasons and for housing affordability. Places where geography or regulations (or both) limit new housing construction could have slower job growth than predicted by their job mix: failing to accommodate booming local industries with more housing could lead to higher housing prices rather than faster job growth. Other state and local policies, too, could also boost or constrain growth relative to what the job mix alone would predict. And places that aging baby boomers eventually move to could see larger-than-expected growth in healthcare jobs and other services that retirees consume.
Still, a local area’s job mix is a tailwind or headwind for future growth. Some fast-growing occupations are clustered in particular places, as are some fast-declining industries. Whether the occupations and industries that lead U.S. economic growth are as predicted or are full of surprises, the local job mix will be a blessing for some markets and a curse for others.
Note: Employment projections are from the Bureau of Labor Statistics (BLS), and the location of workers is from the American Community Survey (ACS). The 818 BLS occupation codes were combined as necessary to match the 473 ACS occupation codes. Location of workers was based on Place of Work Public Use Microdata Areas (PUMAs), which are aggregations of residential PUMAs and are typically equivalent to counties in more urban areas or groups of counties in more rural areas. Place of Work PUMA’s were classified by tract-weighted household density into big, dense cities (weighted density of 2000+ households per square mile); big-city suburbs and lower-density cities (1000-2000); lower-density suburbs and smaller cities (500-1000); and small towns and rural areas (0-500). Approximately 30% of jobs are in big, dense cities; 30% in big-city suburbs and lower-density cities; 20% in lower-density suburbs and smaller cities; and 20% in small towns and rural areas. Data on the location of workers are from the ACS Public Use Microdata Sample (PUMS), 2012-2014.
Yesterday the Bureau of Labor Statistics released its ten-year projections for occupational growth. This post shows which occupations are projected to grow or decline most; it also demonstrates the profound effect aging will have on labor demand and labor supply, and how the projections are good news for women and the well-educated. Healthcare-related occupations, along with personal care and computer & mathematical occupations, will grow fastest, while production (i.e. manufacturing) and farming/forestry/fishing occupations are projected to decline.
Which local markets are favored with fast-growing occupations or saddled with declining ones? I combined BLS national occupational projections for 2014-2024 with Census data on where occupations are located today, based on place of work (see note).
Urban Jobs, Rural Jobs
What do artists and economists have in common? Not much — aside from being the two most urban occupations. More than 60% of both actors and economists are in big, dense cities. But the most urban occupations also include in-person services where local demand is strongest in big cities, like taxi drivers, parking-lot attendants, and elevator installers and repairers.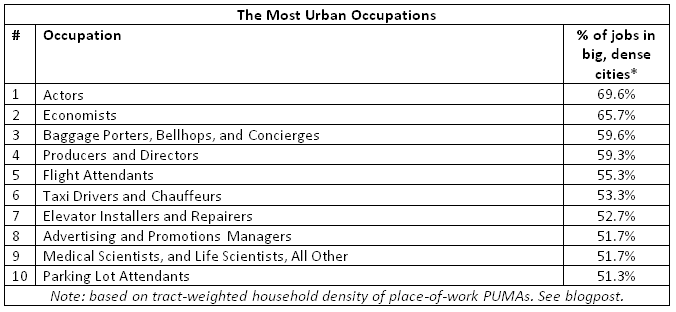
Occupations concentrated in urban areas are projected to grow faster than occupations in other areas. Based on where occupations are located today, urban jobs are projected to grow 6.8% over the next ten years, modestly ahead of suburbs, smaller cities, and rural areas. Rural jobs are disproportionately in manufacturing and natural-resource occupations, which are projected to decline. (This chart shows the weighted average of projected occupational growth in 2014-2014, weighted by today’s occupational mix in each type of area.)
The differences in overall projected occupational growth across areas aren’t huge, and that’s because only some occupations tend to be clustered in certain areas. Many large occupations, like secretaries, cashiers, elementary school teachers, and retail salespeople, are almost everywhere, so the occupational mix varies less across different locations that you might think.
Still, growth in occupations that don’t just serve the local population — like software developers or petroleum engineers — tends to boost growth in other occupations that do service the local population. For instance, if tech is booming and the oil industry is shrinking, then growth in other occupations catering to tech and oil workers — such as retail and personal services — could be faster in tech-heavy San Jose than in oil-dependent Houston. (Economists call this “local multipliers.”) Therefore, the projected differences across areas in occupational growth, shown above, probably understate the important of job mix to local growth.
The Local Markets with the Fastest-Growing Occupations
The same method shows which local markets have the most and least favorable job mixes. Among all metropolitan areas with at least half a million people, Durham-Chapel Hill, NC, has the most favorable job mix for future growth, followed by New Haven and San Jose. Several of these top ten have large local tech industries, including Durham-Chapel Hill, San Jose, Boston, and Washington, DC. Many are among America’s most expensive markets. What accounts for McAllen-Edinburg-Mission, a large, low-income Texas border metro? There, many people work in the growing occupations of home health and personal care, and relatively few in declining routine office occupations.
The inland California metros of Bakersfield, Fresno, and Stockton have the least favorable mix. These metros have young populations and therefore relatively few people in healthcare jobs; furthermore, they have substantial agricultural industries, and Bakersfield has a significant oil and gas industry as well. Largely absent from this list are Midwestern markets, despite their historical reliance on manufacturing.
The differences between metros are very small. Large metros aren’t as different in their occupational mix as you might think. Plus, remember that this approach might understate the impact of job mix on local growth because of the assumption that any given occupation will grow at the same rate in all places; that is, this approach ignores any multiplier effect.
But job mix isn’t necessarily local destiny. People move not only for jobs but also for personal reasons and for housing affordability. Places where geography or regulations (or both) limit new housing construction could have slower job growth than predicted by their job mix: failing to accommodate booming local industries with more housing could lead to higher housing prices rather than faster job growth. Other state and local policies, too, could also boost or constrain growth relative to what the job mix alone would predict. And places that aging baby boomers eventually move to could see larger-than-expected growth in healthcare jobs and other services that retirees consume.
Still, a local area’s job mix is a tailwind or headwind for future growth. Some fast-growing occupations are clustered in particular places, as are some fast-declining industries. Whether the occupations and industries that lead U.S. economic growth are as predicted or are full of surprises, the local job mix will be a blessing for some markets and a curse for others.
Note: Employment projections are from the Bureau of Labor Statistics (BLS), and the location of workers is from the American Community Survey (ACS). The 818 BLS occupation codes were combined as necessary to match the 473 ACS occupation codes. Location of workers was based on Place of Work Public Use Microdata Areas (PUMAs), which are aggregations of residential PUMAs and are typically equivalent to counties in more urban areas or groups of counties in more rural areas. Place of Work PUMA’s were classified by tract-weighted household density into big, dense cities (weighted density of 2000+ households per square mile); big-city suburbs and lower-density cities (1000-2000); lower-density suburbs and smaller cities (500-1000); and small towns and rural areas (0-500). Approximately 30% of jobs are in big, dense cities; 30% in big-city suburbs and lower-density cities; 20% in lower-density suburbs and smaller cities; and 20% in small towns and rural areas. Data on the location of workers are from the ACS Public Use Microdata Sample (PUMS), 2012-2014.
Subscribe to:
Posts (Atom)